
Data-Driven Decision Making for Business Growth

Table of Contents
Think of a seasoned ship's captain navigating treacherous waters. They could rely on their gut and the stars, the way sailors have for centuries. Or, they could use advanced radar, sonar, and weather mapping to chart the safest, most efficient course. That's the essence of data-driven decision making: swapping out guesswork for tangible evidence to guide your business strategy.
So, What Is Data-Driven Decision Making?
At its heart, making decisions with data is about creating a deliberate, systematic process. Instead of running on gut feelings, personal anecdotes, or what you think your customers want, you gather and analyze real information to light the way forward. This disciplined approach transforms ambiguity into a clear advantage, empowering your team to make smarter choices that actually drive growth.
This isn't just a trendy concept anymore; it's how the best companies operate. At leading organizations, an impressive 73% of managers confirm their decisions are consistently based on data. In fact, about 25% of all companies now anchor nearly every strategic move in data, and another 44% do so for most of their decisions. If you're curious, you can dig into more data-driven decision making statistics to see just how widespread this shift has become.
The Big Shift: From Gut-Feel to Hard Evidence
For generations, business leaders leaned heavily on experience and instinct—that classic "gut-feel." While that kind of intuition can be powerful, it’s also notoriously vulnerable to personal biases and blind spots. A founder might pour resources into a new feature because they personally love the idea, only to discover it completely misses the mark with actual users.
Data-driven decision making provides the ultimate reality check. It fosters a culture where every idea is treated as a hypothesis waiting to be proven.
- Instead of assuming, you validate. You look at user behavior analytics, run customer surveys, and check sales figures to see if your beliefs hold up before you go all-in.
- Instead of guessing, you predict. By analyzing past trends and market signals, you can forecast future outcomes with a much higher degree of confidence.
- Instead of reacting, you get ahead. You keep a close eye on your key performance indicators (KPIs) to spot opportunities or brewing problems long before they become emergencies.
This evidence-first mindset doesn't get rid of human expertise; it supercharges it. When you ground your instincts in solid facts, you dramatically cut down on risk and stack the odds of success in your favor.
The goal is to let data tell you a story. It’s not about staring at a spreadsheet full of numbers. It’s about finding the narrative hidden in that data that points you toward the right next step.
Intuition vs. Data-Driven Decisions
The contrast between a decision made on a hunch and one backed by data is night and day. One is based on an internal feeling; the other is built on external, verifiable proof. Recognizing this difference is the first step toward building a team that prioritizes data.
Let's break down how these two mindsets really stack up against each other.
| Aspect | Intuition-Based Approach | Data-Driven Approach |
|---|---|---|
| Foundation | Relies on personal experience, gut feelings, and anecdotal stories. | Built on verifiable metrics, customer behavior, and market analysis. |
| Risk Profile | Higher risk, since it's wide open to personal bias and untested assumptions. | Lower risk, because choices are tested against objective evidence first. |
| Outcome | Results are often a roll of the dice—unpredictable and hard to replicate. | Outcomes are far more predictable, measurable, and repeatable over time. |
| Adaptability | Slow to pivot because it depends on someone changing their mind. | Extremely agile, as new data allows for quick and precise course corrections. |
As you can see, grounding your strategy in data isn't just about being more accurate—it's about building a resilient, adaptable organization that learns and improves with every decision it makes.
Why a Data-First Culture Drives Real Growth

Building a data-first culture is about more than just buying the latest analytics software. It’s a complete mindset shift, changing how your team thinks, operates, and attacks problems day-to-day. When every decision is guided by evidence instead of just a gut feeling, you build an unstoppable engine for growth that touches every corner of your business.
This isn't about small tweaks. It’s about moving from a reactive stance—always playing catch-up with the market—to proactively carving out your own path to success. The results aren't just minor improvements; they are the fundamental advantages that separate the leaders from the laggards.
Uncover and Eliminate Hidden Bottlenecks
Every single business has hidden inefficiencies. These are the processes that eat up time, the misallocated resources, and the frustrating workflow delays that everyone just accepts as "the way things are done." Without data, these problems are practically invisible.
A data-driven approach is like giving your operations an X-ray. When you start tracking metrics—whether it's production cycles, team productivity, or supply chain timing—you can pinpoint exactly where things are breaking down. For instance, a software team might dig into their data and realize one specific phase of QA testing is constantly throwing their project timelines off schedule.
Armed with that knowledge, they can shift people around or redesign the process, turning a chronic bottleneck into a smooth, efficient workflow. This kind of continuous optimization leads to faster delivery, lower costs, and a much more nimble company.
A culture of data isn't about finding fault; it's about finding opportunities. It empowers every employee to ask, "How can we do this better?" and gives them the tools to find a factual answer.
This mindset can have a truly massive impact. Recent research found that organizations that fully embrace data are 23 times more likely to acquire new customers and 19 times more likely to be profitable than their less data-savvy competitors. That's because everyone, on every team, is equipped to solve problems with hard evidence. You can explore the full research on data-driven enterprises to see the numbers for yourself.
Personalize Customer Experiences and Build Real Loyalty
In a crowded market, a generic, one-size-fits-all customer experience just won’t cut it anymore. People expect you to understand what they need and want. Data is the key to delivering that kind of personalized touch, even as you scale.
By analyzing customer data—what they buy, how they browse your site, and the feedback they give—you can move beyond bland, mass-market messaging. You can build targeted campaigns, recommend products people will actually want, and provide customer support that makes each individual feel seen and valued.
Think about an e-commerce brand that notices a specific group of customers keeps buying the same type of product. Using that insight, they can:
- Create Targeted Email Campaigns: Send out special offers and new arrivals that are directly relevant to that product line.
- Customize the Website Experience: Show personalized recommendations on the homepage the next time those customers visit.
- Inform Product Development: Use the sales data to create new items they already know this loyal customer base will love.
This isn't just a marketing trick. It's how you build a real connection with your customers, which dramatically increases loyalty and retention. It turns a simple transaction into a long-term relationship.
Maximize Your Profits with Smarter Spending
Finally, a data-first culture makes sure your most precious resources—time and money—are put where they’ll deliver the biggest punch. This is especially critical when it comes to your marketing and advertising budget.
Instead of just spreading your ad spend across a dozen channels and hoping for the best, data lets you see exactly which campaigns are bringing in customers and which are just burning cash. By tracking metrics like cost-per-acquisition (CPA) and customer lifetime value (CLV) for each channel, you can stop guessing and start making informed choices.
It's simple: you double down on what's working and cut what isn't. This precision maximizes the return on every single dollar you spend, turning your marketing team from a cost center into a predictable and powerful revenue driver.
A Four-Step Framework for Making Data-Driven Decisions
Switching to a data-driven culture can feel like a massive undertaking, but it really doesn't have to be. It all starts with a simple, repeatable process that anyone on your team can get behind.
Think of this framework as your guide—a way to get from a vague business problem to a specific, evidence-backed action. It’s a straightforward loop: ask, collect, analyze, and act. By breaking it down like this, you take the intimidation out of data-driven decision making and turn it into a practical, everyday habit.
This flow shows how to turn raw data into a confident decision.
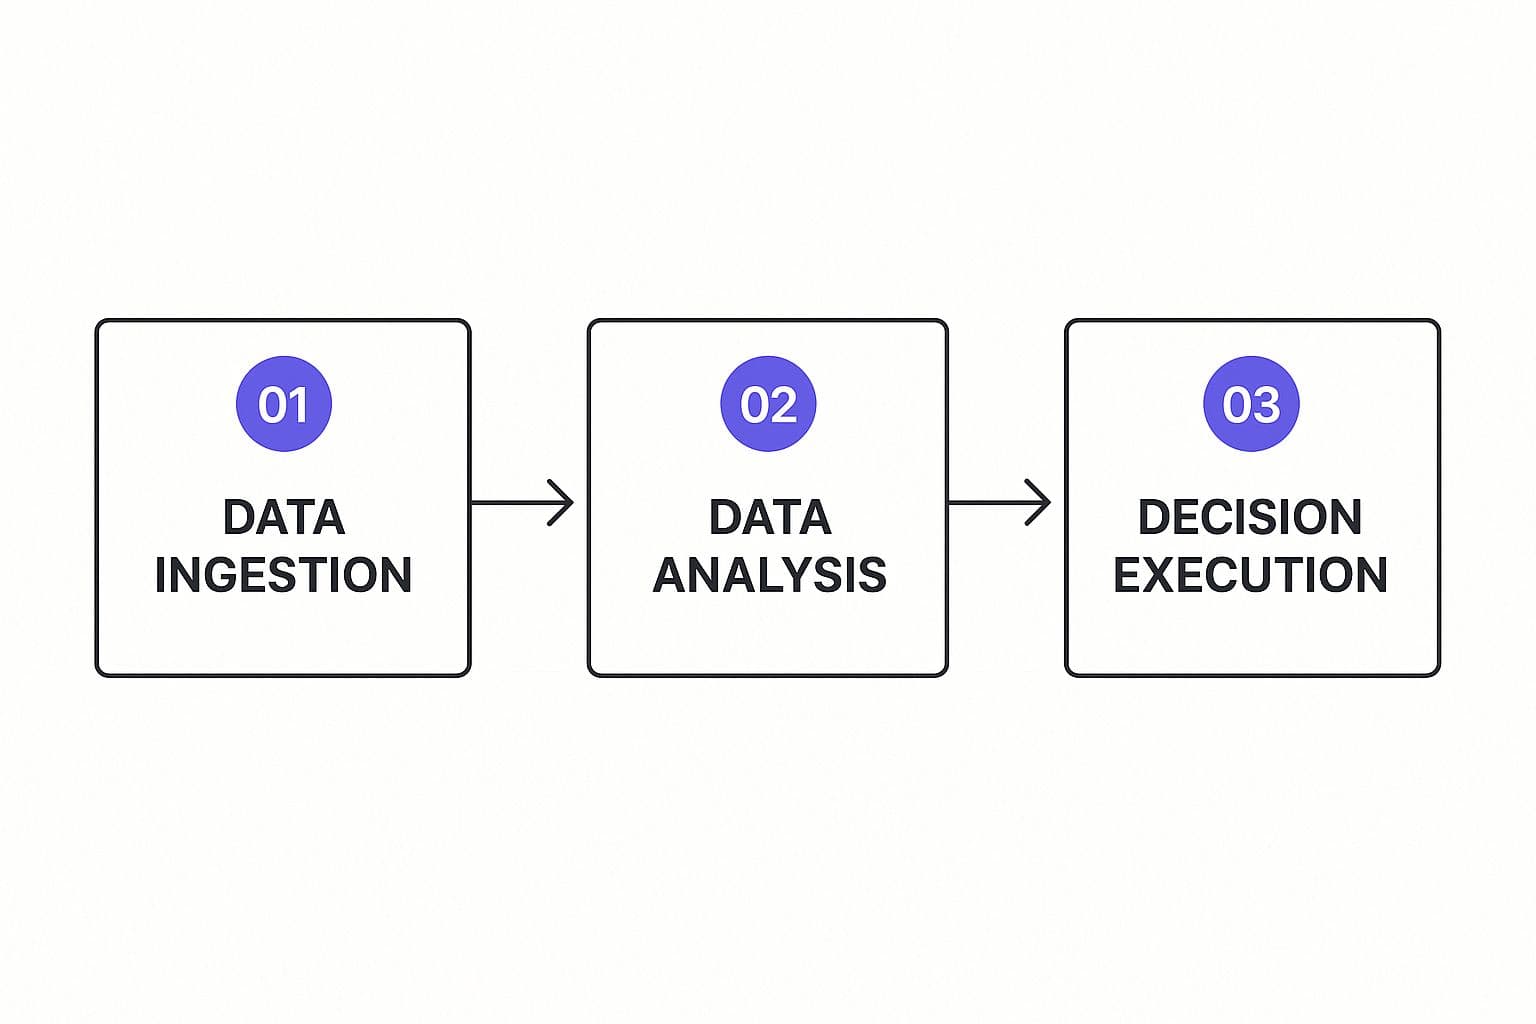
As you can see, each stage builds on the one before it, ensuring your final call is solid, supported, and effective.
Step 1: Pinpoint Your Objective
Before you even glance at a spreadsheet or an analytics dashboard, you need to know exactly what you’re trying to figure out. Collecting data without a clear purpose is like setting sail without a destination—you’ll just drift around and burn through resources.
The best data projects always start with a sharp, well-defined question.
Don't ask something vague like, "How can we increase sales?" Instead, get specific. A much better question is, "Which of our digital marketing channels brought in customers with the highest lifetime value over the last six months?" A focused question like that immediately tells you what data you need and why it matters.
To help sharpen your goals, ask yourself:
- What specific problem are we trying to solve right now?
- What core assumption do we need to either prove or disprove?
- Which key performance indicator (KPI) are we trying to move the needle on?
Defining your objective first makes every other step efficient and focused. It’s the best way to avoid "analysis paralysis," that feeling of being drowned in information but starved for an actual answer.
Step 2: Gather the Right Data
Once you have your question, it's time to collect the information to answer it. This is where a lot of teams get tripped up, thinking they need gigantic datasets to get anywhere. The truth is, the quality and relevance of your data are far more important than the sheer amount.
You’ll typically work with two kinds of data:
- Quantitative Data: This is the "what." It's the hard numbers—objective and measurable. Think website traffic, conversion rates, and sales figures. It’s perfect for spotting trends and patterns at scale.
- Qualitative Data: This is the "why." It's the context behind the numbers—descriptive and subjective. This comes from customer interviews, open-ended survey responses, support tickets, and user reviews.
The real magic happens when you blend them. For instance, your quantitative data might show that 35% of users abandon their carts at the payment stage. That’s a critical "what." To figure out the "why," you could run a quick survey or read through user feedback (your qualitative data) and discover a confusing shipping cost calculator is the culprit.
The best decisions come from the intersection of what the numbers say and what the user stories reveal. One tells you where the problem is; the other tells you how to fix it.
Step 3: Uncover Actionable Insights
With your data in hand, the real work begins: turning raw numbers and feedback into a clear story. This is all about analysis and interpretation. And surprisingly, a huge chunk of a data analyst's time is spent just cleaning and organizing the data to make it usable in the first place.
Your goal here is to find patterns, connections, and outliers that directly answer the question you defined back in Step 1. A software team, for example, might track specific software development KPIs to get a handle on their team's velocity and product quality. A marketing team could dig into campaign data to see which ad copy truly clicks with their audience. To learn more, check out our guide on essential software development KPIs.
But this analysis isn’t just a technical exercise. It's about translation. How do you take a complex dataset and boil it down to a core message that leads to a clear decision? Visualizing data with charts and graphs is often the best way to make the insights pop. A simple bar chart showing a nosedive in user engagement after a recent app update tells a much clearer story than a spreadsheet full of raw numbers.
Step 4: Act and Refine Your Approach
This last step is the most important one: taking action. An insight is completely useless until it drives a decision. Based on your analysis, make a call, implement a change, and—this is crucial—measure the results. This is what closes the loop.
After you’ve made a change, you have to track its impact. Did that A/B test on your homepage actually boost sign-ups? Did the new feature you built based on user feedback really improve retention? This new information feeds right back into the start of the framework, creating a continuous cycle of improvement.
This iterative process is at the heart of lean and agile thinking. You don't make one big, perfect decision. Instead, you make a series of smaller, informed decisions, measure what happens, and adjust your course as you go. Every action becomes a new data point, making your next decision even smarter.
How Winning Startups Use Data to Outsmart Competitors
Understanding the theory is one thing, but seeing it in action is where the real learning happens. For a startup, data isn’t just a nice-to-have; it's the ultimate David vs. Goliath tool. It allows small, nimble teams to compete with established giants by being smarter, faster, and more in tune with what customers actually want.
These stories prove you don’t need a massive budget or a dedicated data science department to unearth game-changing insights. All it takes is a clear question, the right data, and the courage to act on what you find. Let's dig into how three different startups used data to solve critical business problems and fuel their growth.
Case Study 1: The SaaS Onboarding Puzzle
A small B2B SaaS startup was facing a common, yet deadly, problem: a leaky bucket. Their marketing was successfully pulling in sign-ups, but an alarming 60% of new users were gone within the first week. The team’s gut told them the product was just too complex, but gut feelings don't fix churn. They needed evidence.
The Problem: Users were abandoning ship during the critical onboarding phase. The team was flying blind, totally unsure which part of the initial experience was causing so much friction.
The Data-Driven Solution: Instead of guessing, they brought in a user behavior analytics tool to track every click, scroll, and interaction during a user's first seven days. They paired this hard data with qualitative feedback from a simple pop-up survey asking churning users, "What stopped you from moving forward?"
The data painted a crystal-clear picture of a single bottleneck. Users were consistently getting stuck on the third step of the setup process: integrating a third-party app. The numbers showed a staggering 75% drop-off rate at this exact point. The survey responses confirmed it—the instructions were confusing people. Armed with this insight, they ran an A/B test. Version A was the original flow, while Version B introduced a simple, step-by-step video tutorial and clearer text for the integration step.
The Outcome: The results were immediate and powerful. Version B, the flow with the video tutorial, slashed user drop-off by 40% in the first week. This one data-informed change dramatically improved their user activation rate, gave their monthly recurring revenue a direct boost, and proved the immense value of targeted, evidence-based improvements.
Case Study 2: The D2C Product Launch Gamble
A direct-to-consumer (D2C) brand selling eco-friendly home goods wanted to expand its product line. The leadership team had a few ideas bouncing around, but they were nervous about sinking a ton of cash into manufacturing a new product that might just flop. They had to validate demand before committing.
The Problem: Deep uncertainty about which new product to launch, with a high financial risk tied to making the wrong call.
The Data-Driven Solution: The team decided to let their existing customers show them the way. They dug into hundreds of customer support tickets, social media comments, and product reviews, hunting for recurring themes and requests. This qualitative data mining pointed to a strong, untapped desire for a sustainable, all-purpose cleaning solution.
To prove the hypothesis, they spun up a "coming soon" landing page for the new cleaner, complete with mock-up images and a punchy value proposition. They then drove traffic to this page from their email list and social media, tracking just one key metric: the pre-order sign-up rate.
By treating a product launch as a scientific experiment, they replaced a high-stakes gamble with a calculated, low-risk test. The data from the sign-up form became their most reliable market signal.
The Outcome: The pre-order page converted at 25%, blowing their internal benchmark of 5% out of the water. This powerful quantitative signal gave them the green light to move forward with a full production run. When the product officially launched, it became their bestseller within three months—all because they listened to the data their customers were already giving them.
Case Study 3: The Mobile App Feature Roadmap
A new fitness app was struggling to keep users around beyond the first month. The dev team was constantly shipping new features they thought were cool, but engagement was flatlining. It slowly dawned on them that their roadmap was built on assumptions, not actual user needs.
The Problem: They were building features nobody was using, which meant wasted development cycles and stagnant user retention.
The Data-Driven Solution: The product manager pivoted the team's entire focus to data-driven decision making for their roadmap. They started tracking in-app engagement, zeroing in on which features were used most frequently, especially by their most active users. The discovery was a surprise: a simple workout-logging feature, which they had considered basic, was by far the most-used tool in the app.
Based on this insight, they used a simple framework to figure out their next moves. Instead of building shiny new things, they decided to double down on what was already working. (You can explore different ways to do this in our guide on choosing a feature prioritization framework). They brainstormed how to make the workout logger even better, adding things like progress charts and social sharing options.
The Outcome: By focusing on improving a core, validated feature, the team saw a 30% lift in daily active users over the next quarter. Even better, their 30-day user retention rate climbed by 15%. It was a powerful lesson: a great product isn't about having the most features; it's about having the right ones. And data is the only reliable way to know the difference.
Essential Analytics Tools for Lean Startups
You don't need a massive budget or a dedicated data science team to start making smarter, evidence-backed decisions. For a lean startup, the best tools aren't the most expensive or complex ones; they're the ones that give you clear, actionable insights—fast.
Becoming a data-driven company is really about being resourceful. Thankfully, there’s a whole world of affordable, user-friendly tools built specifically for teams just like yours. The trick is to start small and zero in on the metrics that matter most to your business right now.
Understanding Your Website Visitors
Your website is your digital storefront. It’s often the very first place a potential customer interacts with your brand, so understanding who’s stopping by is ground zero for your data strategy. This is where web analytics tools are indispensable.
- Google Analytics (GA4): This is the industry standard for a reason. GA4 is an incredibly powerful—and free—platform for tracking website and app traffic. It shines a light on your audience demographics, how people find you (acquisition channels), and what they do once they arrive. It’s perfect for answering core questions like, "Are my ads on LinkedIn actually bringing in quality leads?"
- Plausible Analytics: If user privacy and simplicity are high on your list, Plausible is a fantastic lightweight, open-source alternative. It delivers all the essential metrics on a single clean dashboard. Plus, it doesn’t use cookies or collect personal data, making it a great way to show customers you respect their privacy from day one.
Here’s a quick look at a standard Google Analytics dashboard. You can see key metrics like user traffic and where those users are coming from.

This kind of visual snapshot immediately tells a story about what’s happening on your site, helping you spot trends without drowning in spreadsheets.
Analyzing How Users Interact with Your Product
Okay, so you know people are visiting your site or app. But what are they actually doing? User behavior tools help you answer that by showing you the clicks, scrolls, and journeys that raw numbers can't.
Think of these tools as providing the "why" behind the "what" you see in your web analytics. They turn anonymous data points into observable user stories, revealing friction points and hidden opportunities for improvement.
- Hotjar: Famous for its heatmaps, Hotjar gives you a visual breakdown of where users click, move their mouse, and scroll. It even offers session recordings, letting you watch anonymized playback of real user sessions to see exactly where they get stuck. It’s a game-changer for optimizing a confusing landing page or a leaky checkout flow.
- Mixpanel: This platform is built to track user actions, or "events," inside your product. It’s how you get answers to questions about feature adoption, user retention, and conversion funnels. For a SaaS startup, it’s invaluable for figuring out which features your most loyal customers can't live without.
Gathering Direct Customer Feedback
Sometimes, the best way to get data is to just ask for it. Customer feedback tools make it easy to collect qualitative insights—the stories, opinions, and feelings that give your quantitative data much-needed context.
- Typeform: Known for its beautiful, conversational surveys, Typeform actually makes filling out a form feel... pleasant. It's a fantastic choice for collecting feedback on new feature ideas, measuring customer satisfaction, or conducting early-stage market research.
- SurveySparrow: This tool specializes in creating chat-like surveys that are more engaging and tend to get higher response rates. It’s great for measuring your Net Promoter Score (NPS) or gathering detailed feedback after a customer makes a purchase.
To help you get started, here's a quick summary of some of the most accessible and impactful tools for any lean startup team.
Essential Analytics Tools for Startups
| Tool Category | Example Tool | Primary Use Case |
|---|---|---|
| Web Analytics | Google Analytics | Tracking website traffic, user sources, and on-site behavior. |
| User Behavior | Hotjar | Visualizing user clicks and scrolls with heatmaps and recordings. |
| Product Analytics | Mixpanel | Analyzing in-app user actions, feature adoption, and retention. |
| Customer Feedback | Typeform | Creating beautiful, conversational surveys to gather direct feedback. |
Choosing just one tool from each category will give you a surprisingly comprehensive view of your business. If you're looking for a wider selection, you can find more great analytics tools in our curated product guide.
Here is the rewritten section, designed to sound completely human-written and natural.
What’s Next? Data-Driven Decisions with AI and Machine Learning
The world of data-driven decision-making is getting a serious upgrade, and it’s all thanks to artificial intelligence (AI) and machine learning (ML). These technologies are completely changing the kinds of questions we can ask our data. We’re moving beyond just looking at what happened in the past; now, we can actually predict what’s coming next and even get smart recommendations on what to do about it.
Think of it like this: traditional analytics is your rearview mirror. It’s great for seeing where you've been. AI and ML, on the other hand, are like a Waze for your business—a smart GPS that not only shows you the road ahead but also suggests the best turns to take based on live traffic.
From Looking Back to Seeing Ahead
This is a massive leap forward. We're moving from simple descriptive reports into much more powerful territory. AI algorithms can dig through enormous, messy datasets faster than any human team ever could, spotting subtle patterns and connections we’d otherwise miss. Suddenly, your historical data becomes a surprisingly reliable crystal ball for future trends.
This is where things get really interesting with predictive and prescriptive analytics:
- Predictive Analytics: This is all about forecasting. It looks at past behavior to tell you which customers are most likely to leave, or which ad campaigns are poised to bring in the best results.
- Prescriptive Analytics: This goes one step further. It doesn’t just predict; it advises. It might tell you the precise discount to offer a specific customer to keep them from canceling.
AI isn’t here to replace human judgment—it’s here to supercharge it. By taking on the mind-numbing work of sifting through data, it frees up your team to focus on the big picture and make smarter, faster, more forward-looking calls.
The impact of this shift is already too big to ignore. By 2025, it’s expected that AI will be a standard part of data analytics globally, changing how companies make strategic choices. Technologies like deep learning are automating the heavy lifting, serving up predictive insights that help leaders make decisions in real-time.
This isn’t some far-off sci-fi future; it’s happening right now. You can discover more about how AI will revolutionize decision making to get a sense of what's on the horizon. The next frontier of data-driven strategy is already here.
Frequently Asked Questions About Data-Driven Decision Making
I hear these questions all the time from teams just starting their journey. Getting clear on these common hurdles can make the whole process feel less intimidating and a lot more effective.
What if I Don’t Have Much Data to Work With?
This is the number one question I get, and the answer is simple: start small. You don't need a mountain of data to get started.
Even a little bit of information is gold. Begin with the basics—things like website traffic, simple customer feedback surveys, or even just tracking your sales trends from week to week. The trick is to start with a real business question and gather only the data you need to answer that specific question. As your startup grows, your data will grow with it.
What’s the Biggest Mistake People Make?
The most common trap is collecting data just for the sake of it. Teams end up drowning in spreadsheets and dashboards, a classic case of "analysis paralysis." They have tons of information but zero direction.
Always, always start with a clear objective or a specific problem you're trying to solve. This keeps your efforts focused and ensures you're looking for answers, not just numbers.
It’s far more important to build a data-curious culture—where everyone feels empowered to ask questions and find answers in the data—than it is to hire a specialist right away. A dedicated data scientist is a great asset, but usually only once your data becomes more complex and the volume really starts to build.
You absolutely do not need a data scientist on day one.
Ready to build your product idea on a foundation of real user data? Iglu Digital specializes in rapid MVP development, helping you launch quickly and start gathering the insights that matter. Learn how we can turn your vision into a market-ready product.